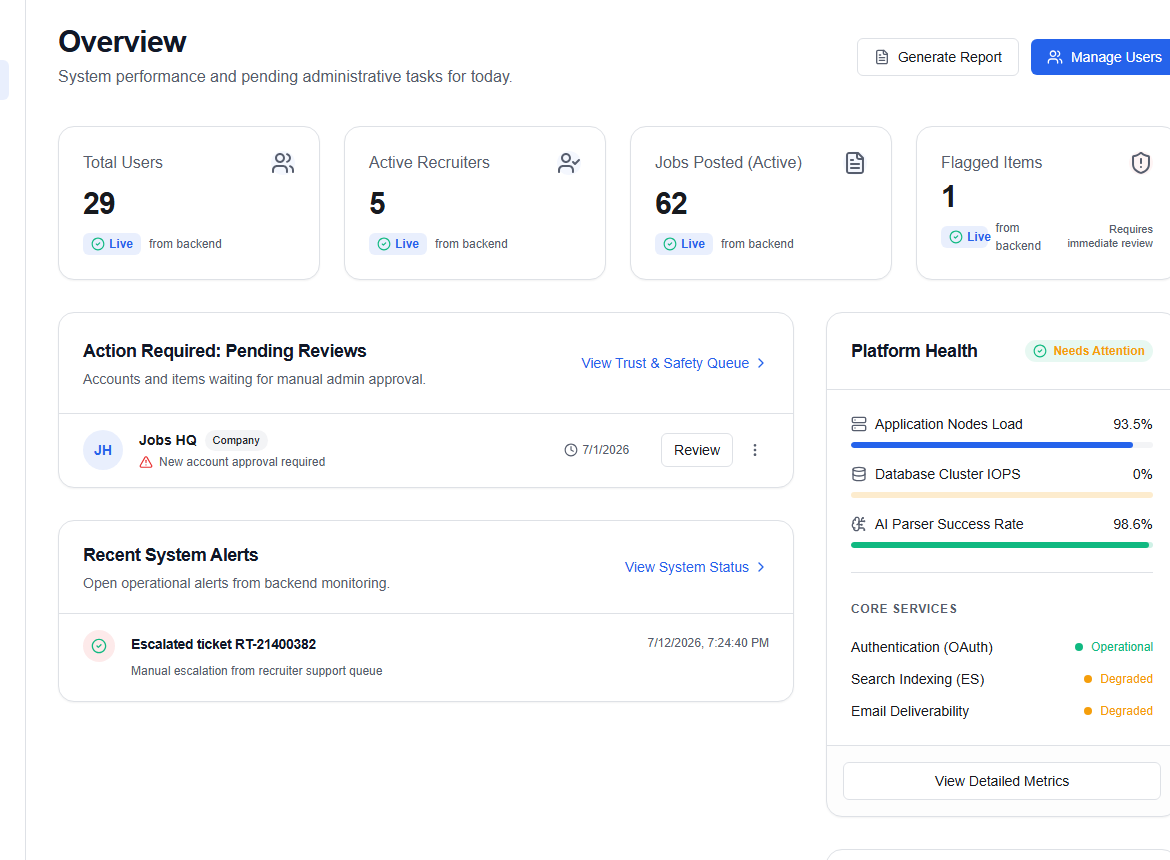
Admin dashboard overview
The Admin Dashboard Overview (/admin) is your homepage for platform operations, showing a snapshot of user signups, system health, company verifications, and audit trails.
Performance metrics & system health
The dashboard pulls live metrics to assess system health:
| Metric | Threshold | Description |
|---|---|---|
| Node Load | < 85% | CPU and memory load on active server nodes |
| Database IOPS | < 85% | Input/output operations per second for the relational database |
| Parser Success Rate | >= 90% | The percentage of successful resume parsing operations |
If all three metrics are within their thresholds, the system shows a green Platform Healthy status badge.
Platform statistics
Aggregated platform stats are displayed in cards:
- Total Users — total registered accounts on OikoHire
- Active Job Posts — currently open and moderated job listings
- Active Companies — verified hiring companies on the platform
- Monthly Revenue — MRR trends (if integrated with billing records)
Company verification queue
All newly registered companies must be verified by an administrator before they can publish jobs.
- Locate the Company Verification Queue panel.
- Review company details (name, domain, logo, website, and business registration).
- Click Verify to authorize the company, or Decline if details are suspicious or incomplete.
Audit logs feed
A real-time feed displays the most recent administrative actions:
- User role updates
- System setting alterations
- Billing modifications
- Moderation choices
Each log contains the event type, target entity ID, actor (who performed the action), and timestamp.