System status
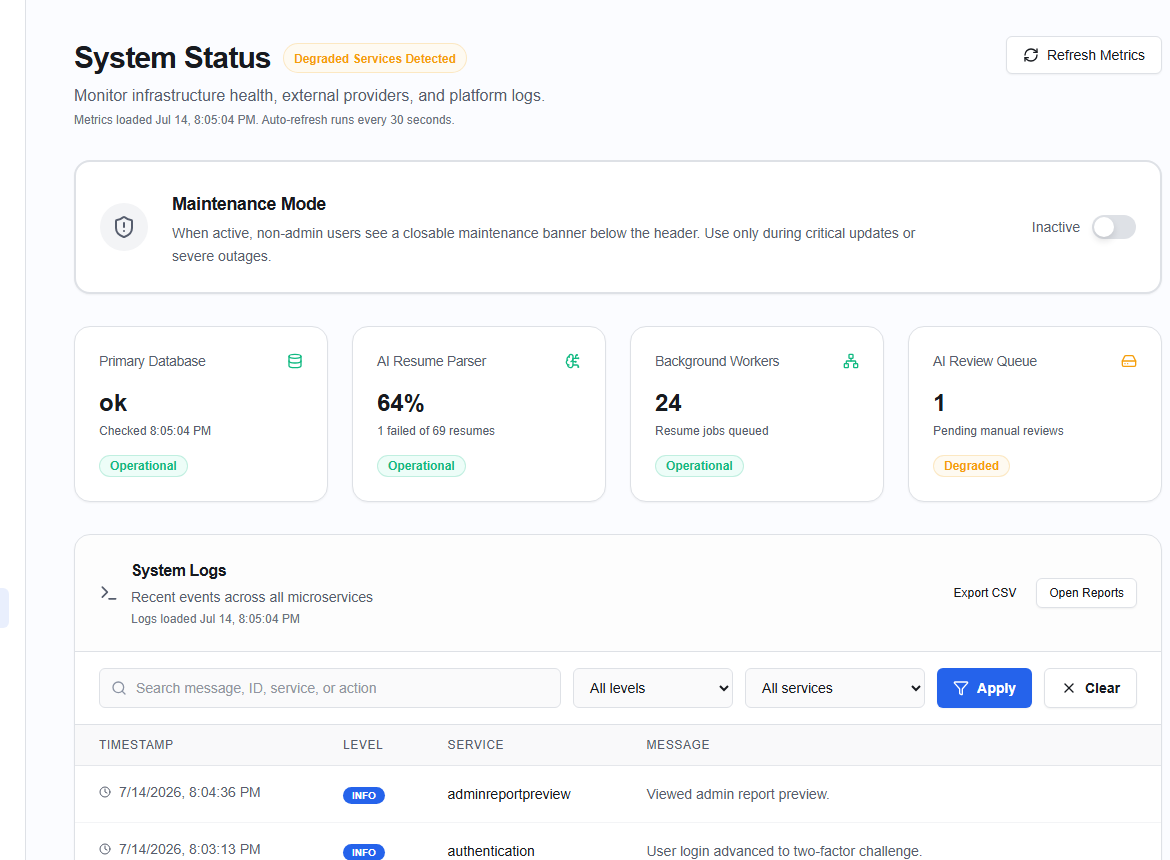
The System Status page (/admin/system) is the real-time operations health monitor. It shows the state of every platform subsystem and gives admins a maintenance mode toggle.
System metrics cards
| Subsystem | Key indicators |
|---|---|
| Primary Database | Operational state (ok, healthy, degraded), last checked timestamp |
| AI Resume Parser | Parse rate percentage, failed count of last N resumes |
| Worker Queue | Queued resume count (threshold ≤ 100 for Operational) |
| AI Review | Pending review count (0 = Operational) |
The overall Platform status banner shows green All systems operational only when all four subsystems pass their thresholds.
Maintenance mode
Toggle Maintenance mode to put the platform into read-only state:
- Flip the Maintenance mode toggle.
- Confirm the action.
- A maintenance banner appears across all user dashboards.
Enabling maintenance mode blocks all write operations (new applications, job posts, messages). Only enable during planned maintenance windows.
System logs
The System Logs panel streams recent backend log entries (last 50). Logs are colour-coded:
| Colour | Level |
|---|---|
| Red | ERROR |
| Yellow | WARN |
| Grey | INFO |
Audit log feed
The Recent Audit panel mirrors the audit feed from the Dashboard Overview, showing the 10 most recent administrative actions.
Data export
Click Export platform data to generate a full administrative data dump (users, jobs, logs) for offline analysis.